Muscle and sport
High muscle mass can raise your BMI without any extra body fat behind it. Pair the result with % body fat or tape measurements.
Type weight and height. 70 kg and 170 cm give a BMI of about 24.2. 92 kg and 180 cm is about 28.4. A mass-to-height ratio, not body composition and not a clinic verdict.
A quick mass-to-height ratio, not a diagnosis. It does not tell muscle from fat. After lifting, try the Navy method. Daily calories live on TDEE.
Weight (kg) and Height (cm). The result shows up here.
BMI in this calculator is mass [kg] divided by height [m] squared. 70 kg and 170 cm: height 1.70 m, 70 ÷ 1.70² ≈ 24.2. 58 kg and 160 cm: 58 ÷ 1.60² ≈ 22.7.
92 kg and 180 cm: 92 ÷ 1.80² ≈ 28.4. With a US header the formula is 703 × weight [lb] ÷ height [in]². The healthy weight range is the mass for BMI 18.5-24.9 at your height.
WHO bands: under 18.5 underweight, 18.5-24.9 normal, 25-29.9 overweight, from 30 the obesity classes. A convention for a quick look at the kitchen table, not a health score and not a muscle measurement. The calculator also shows the mass band for 18.5-24.9: a map, not a medical target.
Type weight and height in the label units, then Calculate. The result is BMI, the band, and a mass range. A comma and a period in 70.5 both parse. The metric and US switch changes labels; do not mix kg with inches in one run.
Muscle is denser than fat, so a gym overweight label can mislead. Girth estimates live on the Navy method. Daily calories live on TDEE. In pregnancy the adult bands do not judge gain: that is a separate card from pre-pregnancy BMI.
48 kg and 170 cm give about 16.6. 52 kg and 162 cm is about 19.8, in range. Children and teens use age- and sex-specific percentile charts; this calculator is for adults. Sleep and labs your doctor ordered sit outside this ratio.
Mass divided by height in meters squared. 70 kg and 170 cm give about 24.2; 92 kg and 180 cm give about 28.4.
Five WHO adult bands - the same split you see in the silhouettes below. Once you calculate, we'll highlight the one that matches your result.
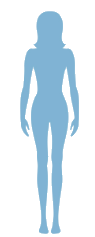
Weight is low for height. Worth reviewing diet and causes with a clinician.

The band most people call "healthy weight" for adults.
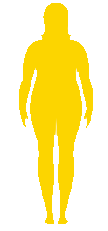
Higher weight for height - a good moment to look at food and movement.
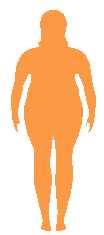
WHO classes I and II. Risk climbs here - a check-up makes sense.

The highest screening band - plan care together with a doctor.
BMI sorts adults by weight relative to height. It's a screening tool: it shows which WHO band you land in - not whether you're "healthy" or "ill".
It gives researchers a shared language and gives you a quick map: underweight, normal, overweight, obesity. Across large groups it works reasonably well.
It doesn't measure fat, see muscle, or know your age or whether you're pregnant. One number can't replace labs or a conversation with a clinician.
For your height we compute the mass that matches BMI 18.5 and 24.9 (BMI 18.5-24.9). That's exactly the span shown as the healthy weight range.
It's orientation, not a personalized target. A muscular, older, or recovering person can sit outside the band for good reasons - and the reverse can be true too.
High muscle mass can raise your BMI without any extra body fat behind it. Pair the result with % body fat or tape measurements.
In older adults, body composition and risk patterns look different from a 30-year-old's. BMI is only one signal, not the whole story.
Adult cut-offs aren't a pregnancy assessment. What matters is the rate of weight gain - that's why there's a dedicated calculator for it.
They need age- and sex-specific percentiles instead. This tool is built for adults.
BMI only answers one question: weight relative to height. These three tools answer different ones - and they're often the better "what next".
What it measures: BMI - weight for height. Body fat % - an estimate of fat share from tape measurements.
When it helps: if you lift, you're showing a "high" BMI while feeling fit, or you just want to know whether your weight is mostly muscle.
What it misses: BMI can't tell fat from muscle. Body-fat estimates are still estimates, not a DXA scan.
Calculate body fat →What it measures: BMR - a rough resting calorie need.
When it helps: when you're planning food, want an energy baseline, or you're comparing diet phases.
What it misses: BMR doesn't judge whether your BMI is "good", and it ignores training load.
Calculate BMR →What it measures: TDEE - daily energy with activity (usually BMR × activity factor).
When it helps: when you want to maintain, build, or reduce weight without guessing calories.
What it misses: TDEE doesn't score your BMI category and doesn't replace clinical care.
Calculate TDEE →Three categories - three different "what next" panels. Card units follow the header (kg/cm or lb/in).
BMI ~16.6 - underweight
The panel points to body-composition context plus protein/TDEE - not just the label.
BMI ~19.8 - normal weight
Inside the WHO band, but the panel still points to body fat, protein, and water as useful next checks.
BMI ~28.4 - overweight
The label can be misleading with strength training - the panel leads with body fat, then BMR and TDEE.
BMI ≈ 22.656
What is BMI at 58 kg and 160 cm? BMI ≈ 22.656.
BMI ≈ 24.221
What is BMI at 70 kg and 170 cm? BMI ≈ 24.221.
BMI ≈ 25.881
What is BMI at 82 kg and 178 cm? BMI ≈ 25.881.
BMI ≈ 24.977
What is BMI at 68 kg and 165 cm? BMI ≈ 24.977.
BMI ≈ 31.02
What is BMI at 95 kg and 175 cm? BMI ≈ 31.02.
BMI is a solid start. These tools answer the next questions: body composition, daily needs, and the cases where adult BMI cut-offs just don't fit.
About 24.2. 70 ÷ 1.70². That sits high in the 18.5-24.9 adult WHO band.
For adults, usually 18.5-24.9. A screening convention, not a point score for health. Under 18.5 is underweight, 25-29.9 overweight, from 30 the obesity classes.
It often reads high. Muscle is denser than fat, so a lean lifter can land in overweight. Add the Navy method when that happens.
The result is the mass band for 18.5-24.9 at your height. A map, not a medical target and not a body-shape guarantee.
58 ÷ 1.60² ≈ 22.7, in range. 48 kg and 170 cm give about 16.6, under 18.5.
They use age- and sex-specific percentile charts. This calculator is for adults.
Adult bands do not judge pregnancy. Gain is paced from pre-pregnancy BMI on the pregnancy-gain card.
Girths and % BF on the Navy method, daily calories on TDEE, sleep, and labs your doctor ordered. BMI is a kitchen-table start, not the whole report.
92 ÷ 1.80² ≈ 28.4, the 25-29.9 band. After lifting that label can mislead: Navy tape first, then TDEE.
Not in one run. Both fields in kg and cm, or both in lb and inches. The switch changes labels; it does not convert numbers you already typed.
The 18.5–24.9 bands in this calculator are the WHO convention for adults, not a diagnosis.
Page updated in 2026.